Demo
demo1_motif:
Predict protein-DNA binding affinity matrices for target transcription factors (TFs) and identify associated DNA motifs. In demo1, we assume the independence of each nucleotide.
Demo1 contains two types of transcription factors (TF): ACE2 and SWI4, corresponding to the two sub-demos demo1_independent_ace2_0.1K.sh and demo1_independent_swi4_2K.sh respectively.
sbatch job_demo1

# Alternatively, you can run the individual demos:
./demo1_independent_ace2_0.1K.sh
./demo1_independent_swi4_2K.sh
Taking ACE2 as an example (demo1_independent_ace2_0.1K.sh), here is a basic usage example.
Input
demo1_motif/in/ace2_0.1K/demo_ace2_0.1Kseq_gctggt.txt
demo1_motif/in/ace2_0.1K/demo_ace2_0.1Kseq_gctggt.fa
Code
In the demo1_independent_ace2_0.1K.sh script, we want to compare the time taken with and without the parallel option. The following code activates the bpf bayesPI functionality, utilizing the parallel flag and specifying the number of user_cores.
echo "Run bpf using 5 cores for parallelization"
echo "Export at: demos/demo1_independent/out/demo1_out_bpf_t1/ace2_0.1K"
(time bpf bayesPI -seed=1 -initial_beta=500,50,5 -max_evidence=3 -dependence=0 -strand=0 -max_iteration=500 -normalize=2 \
-max_loop=3 \
-out=../out/demo1_out_bpf_t1/ace2_0.1K \
-exp=../in/ace2_0.1K/demo_ace2_0.1Kseq_gctggt.txt \
-seq=../in/ace2_0.1K/demo_ace2_0.1Kseq_gctggt.fa \
-parallel -user_cores=5 -min_L=6 -max_L=10 -p_value=0.001) 2 > ../out/demo1_out_bpf_t1/ace2_0.1K/error.demo1_ace2_0.1K_bpf
Output
In the above example, the motif length is set to a minimum of 6 bases and a maximum of 10 bases. Additionally, the parallel options are set with -user_cores=5.
As a result, the final output includes a PSAM matrix for each motif length, along with the corresponding log files, as shown below:
out/demo1_out_bpf_t1
   |- ace2_0.1k
   |  |- demo_ace2_0.1Kseq_gctggt.txt_mlpout_L6_1.mlp
   |  |- demo_ace2_0.1Kseq_gctggt.txt_mlpout_L7_1.mlp
   |  |- demo_ace2_0.1Kseq_gctggt.txt_mlpout_L8_1.mlp
   |  |- demo_ace2_0.1Kseq_gctggt.txt_mlpout_L9_1.mlp
   |  |- demo_ace2_0.1Kseq_gctggt.txt_mlpout_L10_1.mlp
   |  |- log_S1_L6
   |  |- log_S2_L7
   |  |- log_S3_L8
   |  |- log_S4_L9
   |  |- log_S5_L10
   |  |- log_S5_L10
   |  |- error.demo1_ace2_0.1K_bpf
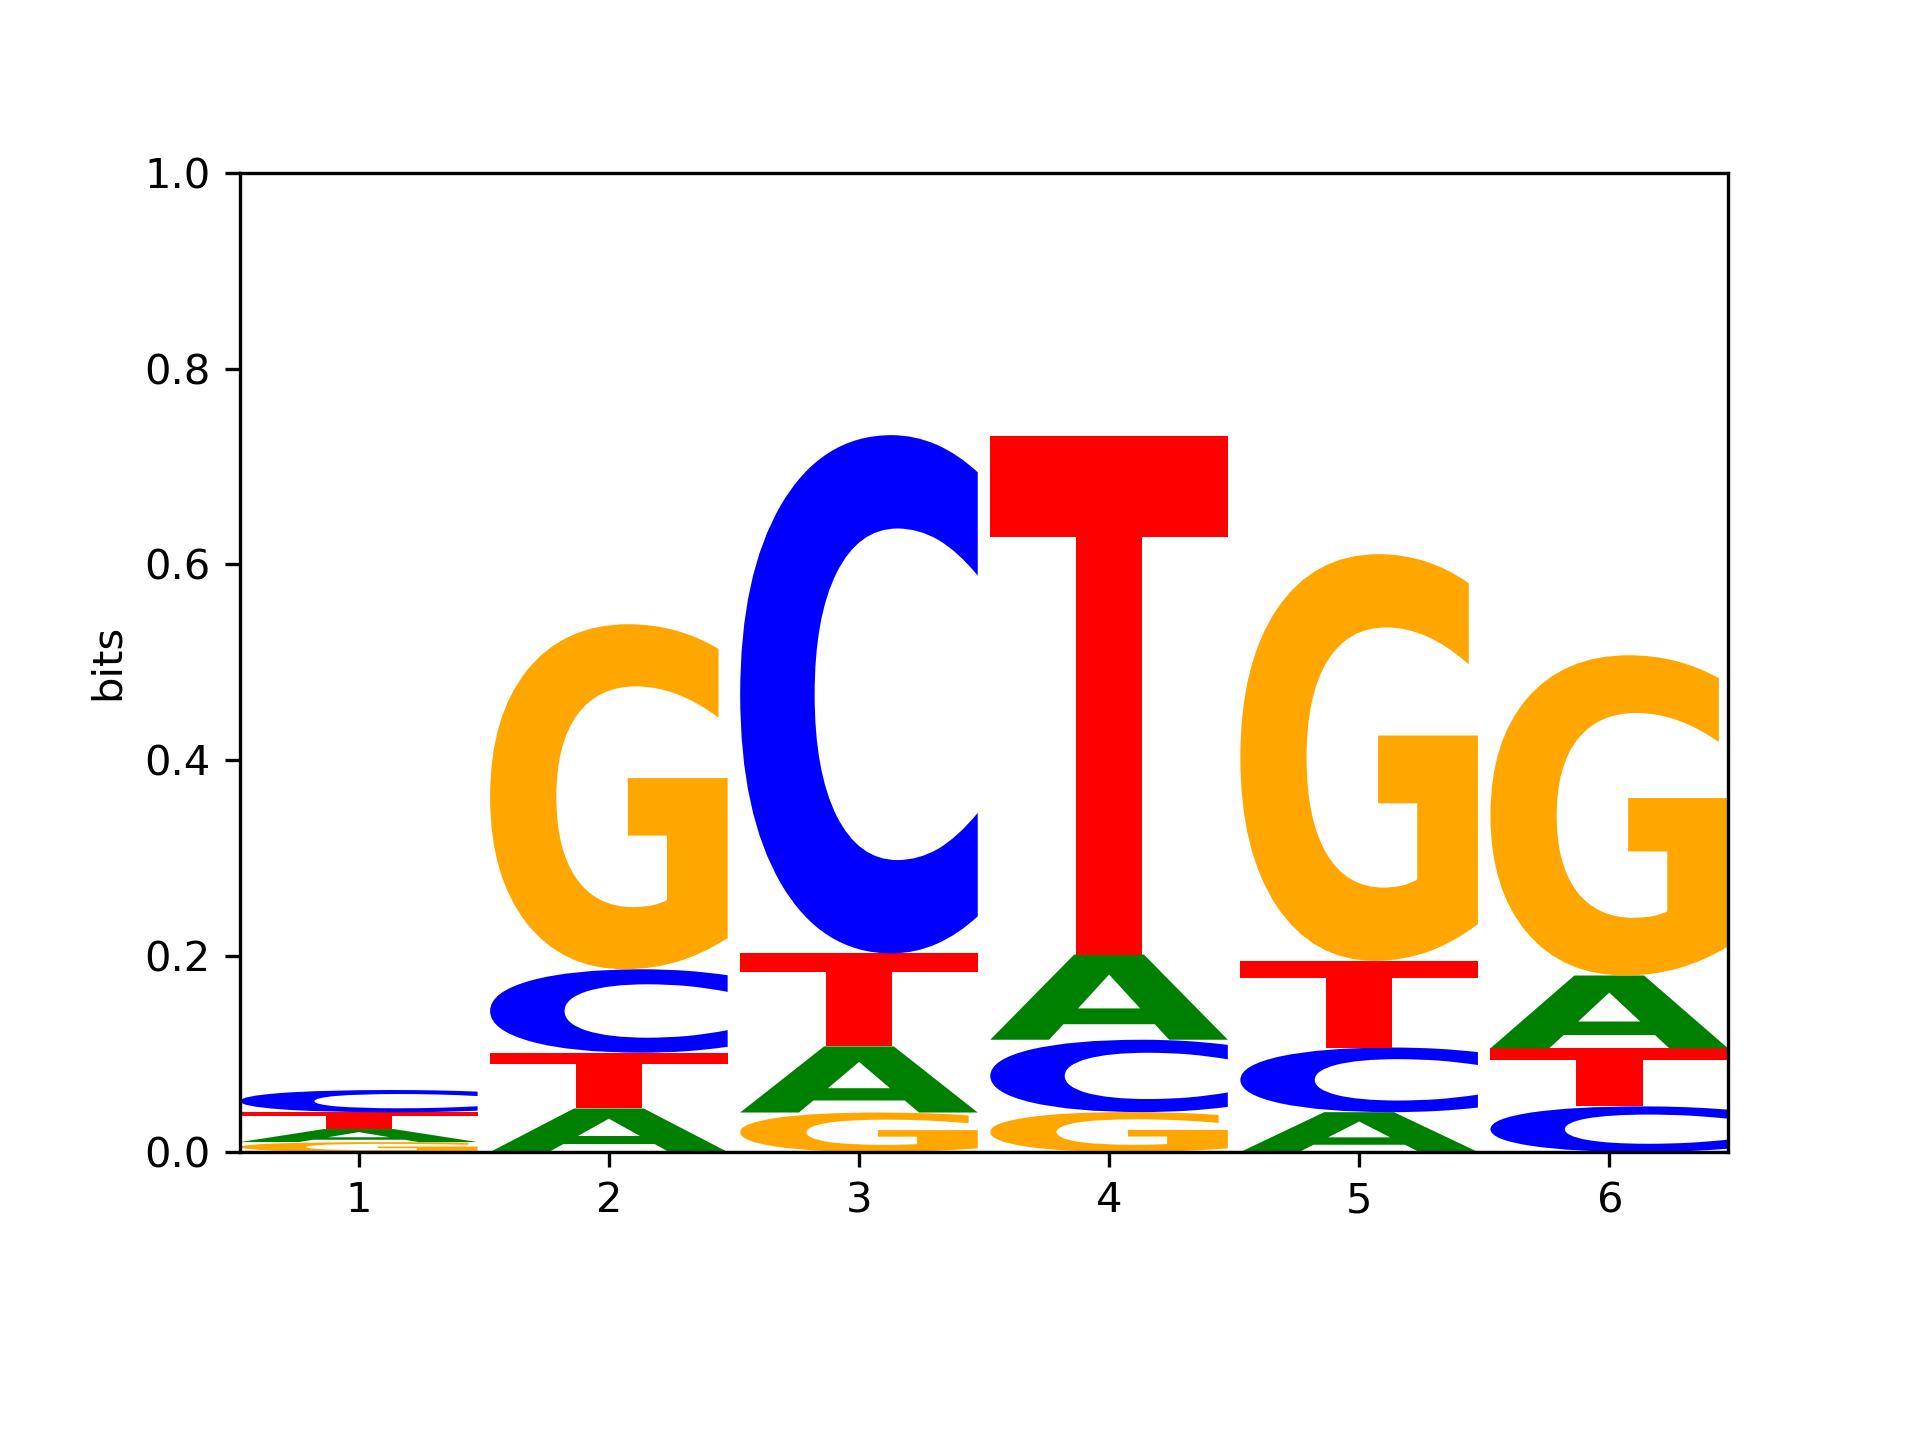
Among them, when motif_length=6, the results of the binding affinity matric in demo_ace2_0.1Kseq_gctggt.txt_mlpout_L6_1.mlp are:
nucleotide |
a |
c |
g |
t |
|---|---|---|---|---|
c |
0.74724306686324027 |
1.2759837425504077 |
0.56698383886360115 |
0.95816838046764075 |
g |
0.40376773149443163 |
0.77463518426667954 |
3.2019016654587409 |
0.51722884120337764 |
c |
0.52962660830922337 |
4.1522862696325049 |
0.31629466850952381 |
0.74468155290330562 |
t |
0.67986460124544101 |
0.57764506718348219 |
0.31870531423072723 |
4.1385360918265537 |
g |
0.34612747709397218 |
0.56201213675680073 |
3.5345202847981922 |
0.7533682281783346 |
g |
0.69663332358645791 |
0.43659844547252891 |
3.0646109714127938 |
0.55572222792180148 |
The sequence_logo of demo_ace2_0.1Kseq_gctggt.txt_mlpout_L6_1.mlp is as follows:
demo2_dinuc:
In demo2, we consider DNA structural features as a specific form of position-specific dinucleotide dependency, using the bpf shape_heatmap functionality to generate the heatmap.
# run the demo2
./demo2_dinucleotide_dependence.sh
Input
demo2_dinuc/in/Gcm1_3732.1_v2_deBruijn.aligned.train.fasta.mini
demo2_dinuc/in/Gcm1_3732.1_v2_deBruijn.signal
Code
echo "Run the parallel bayesPI using 6 cores"
echo "Export at: demos/demo2_dinucleotide_dependence/out/demo2_out_bpf_t1"
echo
(time bpf bayesPI -out=../out/demo2_out_bpf_t1 \
   -seq=../in/Gcm1_3732.1_v2_deBruijn.aligned.train.fasta.mini \
   -exp=../in/Gcm1_3732.1_v2_deBruijn.signal \
   -normalize=4 -min_L=10 -max_L=15 -max_loop=1 -flank_sequence=5 \
   -dependence=1 -seed=1 \
   -parallel -user_cores=6 \
   -information_content_threshold=0 \
   -max_evidence=2 -max_iteration=200) 2> ../out/demo2_out_bpf_t1/error.demo2_bpf


echo "Generating dinucleotide heatmaps"
input_dir="../out/demo2_out_bpf_t1"
file_pattern="*.interct"

for file in "$input_dir"/$file_pattern; do
if [[ -f $file ]]; then
   echo "Processing file: $file"
   bpf shape_heatmap -sf="$file"
else
   echo "No matching .interct files found in $input_dir"
fi
done
Output
In the above example, the motif length is set to a minimum of 10 bases and a maximum of 15 bases, and parallel processing is enabled using the -user_cores=6 option. Therefore, the output includes the PSAM matrix and interaction matrix for each motif length, as well as the corresponding log files. In addition, a heat map is generated based on the interaction matrix for each motif length to describe the interactions between dinucleotides in a visual way.
Take a motif_length = 10 as an example to show the output results.
out/demo2_out_bpf_t1
   |- Gcm1_3732.1_v2_deBruijn.signal_mlpout_L10_1.mlp
   |- Gcm1_3732.1_v2_deBruijn.signal_Wij_L10_1.interct
   |- Gcm1_3732.1_v2_deBruijn.signal_Wij_L10_1.interct.png
   |- log_S1_L10
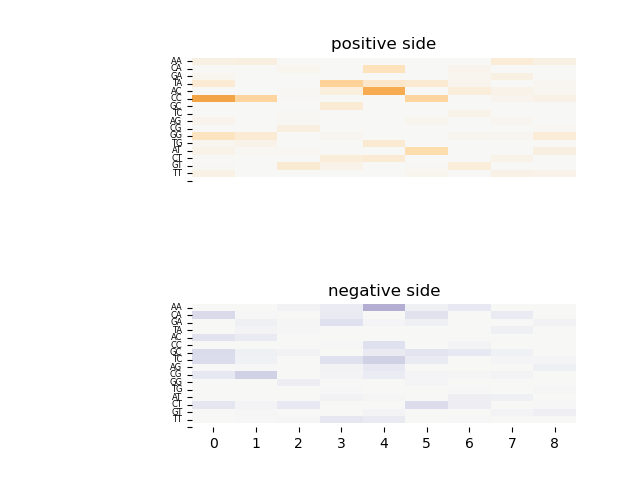
We can see that in addition to the .mlp file output includes the .interct file and the .png file, which showing the interaction of dinucleotides The .interct file is as follows:
Position |
AA |
CA |
GA |
TA |
AC |
CC |
GC |
TC |
AG |
CG |
GG |
TG |
AT |
CT |
GT |
TT |
|---|---|---|---|---|---|---|---|---|---|---|---|---|---|---|---|---|
1, 2 |
-0.1839 |
0.5667 |
-0.0791 |
-0.3174 |
0.4036 |
-1.4229 |
0.5429 |
0.5358 |
-0.0944 |
0.3169 |
-0.5147 |
-0.0546 |
-0.1259 |
0.3461 |
-0.0248 |
-0.1497 |
2, 3 |
-0.1990 |
0.0050 |
0.1606 |
0.0722 |
0.2437 |
-0.7533 |
0.1562 |
0.1383 |
0.0228 |
0.7213 |
-0.3275 |
-0.1176 |
-0.0363 |
0.0791 |
0.0281 |
0.0086 |
3, 4 |
0.1015 |
-0.0917 |
0.0412 |
0.0380 |
-0.0357 |
-0.0407 |
0.1022 |
-0.0335 |
-0.0458 |
-0.1985 |
0.2065 |
-0.0027 |
-0.0336 |
0.3146 |
-0.3516 |
0.0417 |
4, 5 |
0.2113 |
0.2792 |
0.4463 |
-0.8162 |
-0.2361 |
0.0155 |
-0.3162 |
0.4467 |
0.1113 |
0.0777 |
-0.0489 |
0.0201 |
0.0962 |
-0.2653 |
-0.1225 |
0.3306 |
5, 6 |
1.1588 |
-0.5396 |
0.0662 |
-0.4105 |
-1.3276 |
0.4479 |
0.2765 |
0.7198 |
0.3222 |
0.2200 |
-0.0162 |
-0.3504 |
0.0253 |
-0.3279 |
0.0932 |
0.2499 |
6, 7 |
0.1606 |
0.4440 |
0.1442 |
-0.3421 |
-0.0085 |
-0.7673 |
0.3789 |
0.2534 |
-0.0880 |
0.0473 |
0.0530 |
-0.0157 |
-0.6421 |
0.5196 |
-0.0345 |
-0.0828 |
7, 8 |
0.3251 |
-0.1055 |
-0.0734 |
-0.0989 |
-0.2770 |
0.0713 |
0.3103 |
-0.1284 |
-0.0192 |
0.0301 |
-0.0796 |
0.0200 |
0.1731 |
0.2080 |
-0.2732 |
0.0076 |
8, 9 |
-0.2821 |
0.2749 |
-0.1789 |
0.1559 |
-0.1264 |
-0.1123 |
0.1400 |
0.0637 |
-0.0672 |
0.0722 |
-0.0547 |
-0.0094 |
0.1615 |
-0.1401 |
0.0775 |
-0.1552 |
9, 10 |
-0.1739 |
-0.0223 |
0.1040 |
-0.0507 |
-0.0535 |
-0.1507 |
-0.0158 |
0.0602 |
0.1584 |
-0.0267 |
-0.2948 |
0.0419 |
-0.1878 |
0.0043 |
0.1842 |
-0.1372 |
The dinucleotide interaction heatmap of Gcm1_3732.1_v2_deBruijn.signal_Wij_L10_1.interct is as follows:
demo3_shape:
Considering that local DNA structural properties, such as the geometry of the DNA molecule, can influence protein-DNA interactions, we incorporated these DNA shape features into our predictions of protein-DNA binding affinities. And the dinucleotide combination of DNA structure properties is derived from the DiProDB database.
sbatch job_demo3

# Alternatively, you can run the individual demos:
./demo3_shapemodel_ap2gamm.sh
./demo3_shapemodel_hnf4.sh
./demo3_shapemodel_ap2gamm_parallel.sh
Demo3 includes two types of transcription factors (TFs), ap2gamm and hnf4, which correspond to two sub-demos: demo3_shapemodel_ap2gamm.sh and demo3_shapemodel_hnf4.sh. Additionally, there is a sub-demo, demo3_shapemodel_ap2gamm_parallel.sh, which explores the parallelization options for ap2gamm and is used to test the time efficiency of parallel processing.
Taking ap2gamm as an example (demo3_shapemodel_ap2gamm_parallel), here is a basic usage example.
Input
demo3_shape/in/ap2gamma.signal
demo3_shape/in/ap2gamma.fasta
demo3_shape/shape_feature_files/DiProDB_PCs.dat
Code
In the demo3_shapemodel_ap2gamm.sh script, we added the dinuc_transform parameter to the shape model.
echo "Export at: demos/demo3_shape/out/demo3_ap2gamm_out_bpf_t3"
echo "Fitting new shape model with parallel and user_cores parameter"
(time bpf bayesPI -seq=../in/ap2gamma.fasta \
      -exp=../in/ap2gamma.signal \
      -out=../out/demo3_ap2gamm_out_bpf_t3/ \
      -strand=2 -dependence=1 -normalize=4 -b1_fixed=0 \
      -max_iteration=500 -max_evidence=25 \
      -max_L=10 -min_L=7 \
      -parallel -user_cores=4 \
      -dinuc_transform=../shape_feature_files/DiProDB_PCs.dat -max_loop=1 -seed=1 ) 2> ../out/demo3_ap2gamm_out_bpf_t3/error.demo3_bayesPI_shape
The following code indicates that we rename the output of shape model, convert predicted di-nucleotide interaction matric to shape features based on an input table of di-nucleotide shape features with bpf interct2shape functionality and plot the heatmap of shape features with bpf shape_heatmap functionality.
mv ../out/demo3_ap2gamm_out_bpf_t3/ap2gamma.signal_mlpout_L7_1.mlp ../out/demo3_ap2gamm_out_bpf_t3/shape_new_L7_1.mlp
mv ../out/demo3_ap2gamm_out_bpf_t3/ap2gamma.signal_Wij_L7_1.interct ../out/demo3_ap2gamm_out_bpf_t3/shape_new_L7_1.interct

echo "Option1.1: Converting dinucliotide models to shape space"
echo "Output: shape_new_L7_1.shape"
bpf interct2shape -sff=../shape_feature_files/DiProDB_PCs.dat -imf=../out/demo3_ap2gamm_out_bpf_t3/shape_new_L7_1.interct
echo
echo "Option1.2: direct shape heatmaps ... "
bpf shape_heatmap -sf=../out/demo3_ap2gamm_out_bpf_t3/shape_new_L7_1.shape
Output
In the above example, the motif length is set to a minimum of 7 bases and a maximum of 10 bases. Additionally, the parallel options are set with -user_cores=4.
Take a motif_length = 7 as an example to show the output results.
out/demo3_ap2gamm_out_bpf_t3
   |- shape_new_L7_1.mlp
   |- shape_new_L7_1.interct
   |- shape_new_L7_1.shape
   |- shape_new_L7_1.shape.png
   |- log_S1_L7
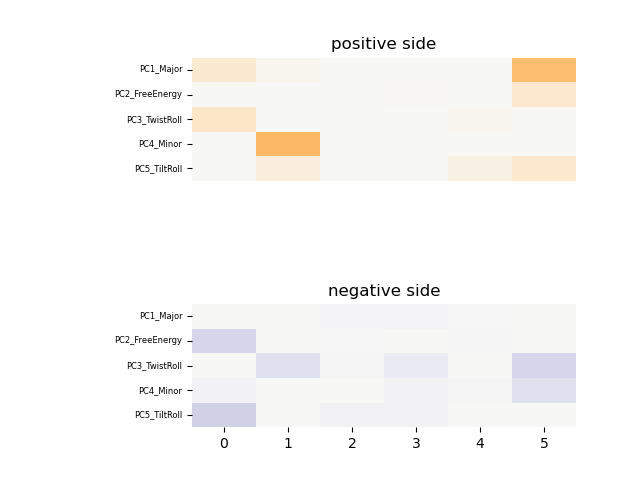
We can see that in addition to the .mlp file and .interct file output includes .shape file and the .png file. The .shape file is as follows:
Position |
PC1_Major |
PC2_FreeEnergy |
PC3_TwistRoll |
PC4_Minor |
PC5_TiltRoll |
|---|---|---|---|---|---|
1, 2 |
-0.3451 |
0.6526 |
-0.4285 |
0.0953 |
0.7080 |
2, 3 |
-0.0821 |
-0.0027 |
0.4511 |
-1.1831 |
-0.2364 |
3, 4 |
0.0510 |
0.0104 |
0.0370 |
-0.0117 |
0.1000 |
4, 5 |
0.0647 |
-0.0284 |
0.2287 |
0.1050 |
0.0953 |
5, 6 |
0.0089 |
0.0274 |
-0.0710 |
0.0467 |
-0.1738 |
6, 7 |
-1.1065 |
-0.3864 |
0.6386 |
0.4610 |
-0.3984 |
The heatmap of shape features of shape_new_L7_1.shape is as follows:
demo4_methy:
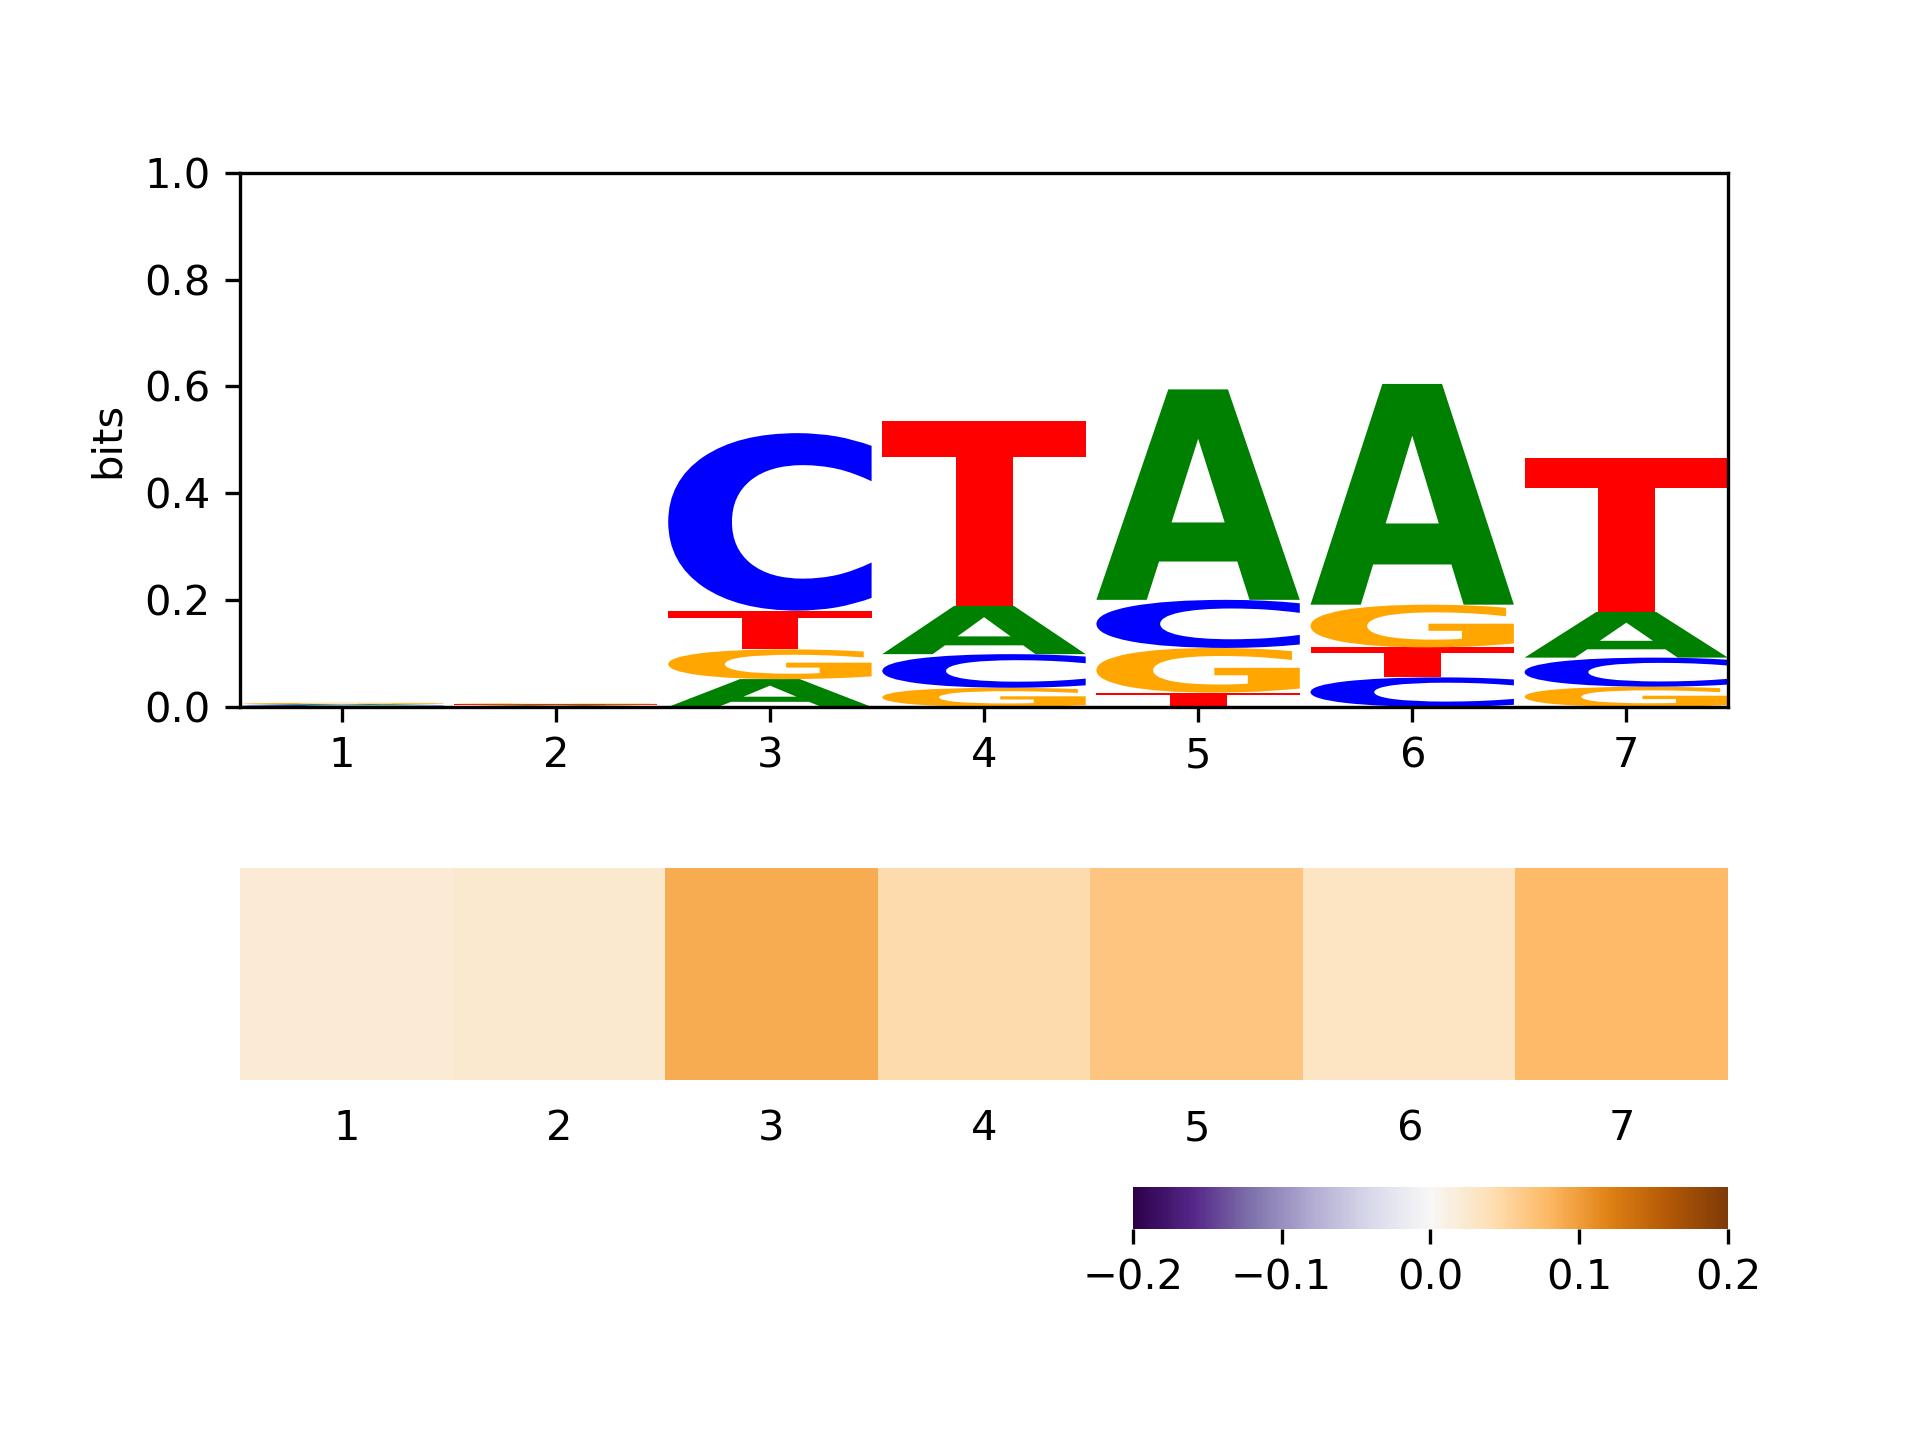
Considering that DNA methylation can alter TF binding potential by either enhancing or reducing affinity at specific positions, we incorporate methylation levels to quantify the methylation intensity. This can be applied at each position or across the entire motif, depending on the methylation_hires option.
A positive number indicates that the position is highly methylated; a negative number indicates that the position is less methylated; close to zero means no effect
The job_demo4 contains several sub-demos. The file names include hires, which means calculating the methylation factor of each position, parallel, which means using the parallel option to test the time spent, and seed, which means using different seeds to synthesize the input data.
sbatch job_demo4_parallel_hires
./demo4_methylation_hires_parallel.sh

sbatch job_demo4_parallel_no_hires
./demo4_methylation_parallel.sh

sbatch job_demo4_seed1
./demo4_methylation_hires_seed1.sh
./demo4_methylation_seed1.sh

sbatch job_demo4_seed2
./demo4_methylation_hires_seed2.sh
./demo4_methylation_seed2.sh

sbatch job_demo4_seed3
./demo4_methylation_hires_seed3.sh
./demo4_methylation_seed3.sh
Here, take demo4_methylation_hires_parallel.sh script and demo4_methylation_parallel.sh script as examples.
Input
demo4_methy/in/smooth/seed_1_methylation_positive_motif_ctaat.signal
demo4_methy/in/smooth/seed_1_methylation_positive_motif_ctaat.fasta
demo4_methy/in/smooth/seed_1_methylation_positive_motif_ctaat.methylation
Code
In the demo4_methylation_hires_parallel.sh script, we’ve added the methylation_data and methylation_hires parameters. and incorporated the bpf sequence_logo functionality to visualize sequence markers with with_methy flag.
echo "1.Fitting the methyalation model with parallel and user_cores parameter"
(time bpf bayesPI -seq=../in/smooth/seed_1_methylation_positive_motif_ctaat.fasta \
      -exp=../in/smooth/seed_1_methylation_positive_motif_ctaat.signal \
      -out=../out_hires/seed_1_methylation_positive_motif_ctaat.fasta/parallel \
      -methylation_data=../in/smooth/seed_1_methylation_positive_motif_ctaat.methylation \
      -methylation_hires \
      -max_L=$Max_LENGTH -min_L=$Min_LENGTH -max_loop=1 \
      -seed=$SEED -strand=$STRAND -normalize=$NORMALIZE \
      -max_iteration=$ITERATION -max_evidence=$EVIDENCE \
      -information_content_threshold=0.1 \
      -parallel -user_cores=5) 2> ../out_hires/seed_1_methylation_positive_motif_ctaat.fasta/parallel/error.demo4_parallel

## using the methylation value
echo "Enter the entire folder when drawing sequence markers with methylation files"
bpf sequence_logo -ff=../out_hires/seed_1_methylation_positive_motif_ctaat.fasta/parallel \
-sn='seed_1_methylation_positive_motif_ctaat.signal' \
-max_L=9 -min_L=5 \
-max_N=1 -min_N=1 \
-with_methy
In the demo4_methylation_parallel.sh script, we added the methylation_data parameter without the methylation_hires flag.
echo "1.Fitting the methyalation model with parallel and user_cores parameter"
(time bpf bayesPI -seq=../in/smooth/seed_1_methylation_positive_motif_ctaat.fasta \
      -exp=../in/smooth/seed_1_methylation_positive_motif_ctaat.signal \
      -out=../out/seed_1_methylation_positive_motif_ctaat.fasta/parallel \
      -methylation_data=../in/smooth/seed_1_methylation_positive_motif_ctaat.methylation \
      -max_L=$Max_LENGTH -min_L=$Min_LENGTH -max_loop=1 \
      -seed=$SEED -strand=$STRAND -normalize=$NORMALIZE \
      -max_iteration=$ITERATION -max_evidence=$EVIDENCE \
      -information_content_threshold=0.1 \
      -parallel -user_cores=5) 2> ../out/seed_1_methylation_positive_motif_ctaat.fasta/parallel/error.demo4_parallel
Output
Take a motif_length = 7 in the demo4_methylation_hires_parallel.sh script as an example to show the output results.
out_hires/seed_1_methylation_positive_motif_ctaat.fasta
   |- parallel
   |  |- seed_1_methylation_positive_motif_ctaat.signal_mlpout_L7_1.mlp
   |  |- seed_1_methylation_positive_motif_ctaat.signal_mlpout_L7_1.methylation_factors
   |  |- seed_1_methylation_positive_motif_ctaat.signal_mlpout_L7_1_with_methy.jpg
   |  |- seed_1_methylation_positive_motif_ctaat.signal_mlpout_L7_1.eps
   |  |- log_S3_L7
methylation_factors |
|---|
0.0207718 |
0.0246429 |
0.0885084 |
0.0452167 |
0.0656626 |
0.0318169 |
0.077055 |
The sequence logo of seed_1_methylation_positive_motif_ctaat.signal_mlpout_L7_1.mlp with methylation_factors is as follows:
demo5_affnity:
In this demo, we utilize bayesPI_affinity tool to estimate the TF binding affinity. There are several steps using different data and parameters to run.
Here’s a brief explanation of the steps 5 in this script, using it as an example:
Input
demo5_affnity/in/Hnf4a_2640.2_v1_deBruijn.txt_fa
demo5_affnity/in/Hnf4a_2640.2_v2_deBruijn.txt_Int_mlpout_L12_1.mlp
demo5_affnity/in/Hnf4a_2640.2_v2_deBruijn.txt_Int_Wij_L12_1.intect
Code
echo "5.Scan a PSM with its predicted di-nucleotide depence matrix on two strands of DNA sequence where 3bp flank sequences are added in both sides.
#to compute the affinity"
rm ../out/Hnf4a_2640.2_v2_deBruijn.txt_Int_mlpout_L12_1.mlp_bindingP_0_randomBackground_100 &> /dev/null
../../bin/$OS/bayesPI_affinity -out=../out/ \
   -seq=../in/Hnf4a_2640.2_v1_deBruijn.txt_fa \
   -psam=../in/Hnf4a_2640.2_v2_deBruijn.txt_Int_mlpout_L12_1.mlp \
   -di_nucfile=../in/Hnf4a_2640.2_v2_deBruijn.txt_Int_Wij_L12_1.intect \
   -shuffle=100 -flank_sequence=3 -strand=2 &> /dev/null
Output
out
   |- Hnf4a_2640.2_v2_deBruijn.txt_Int_mlpout_L12_1.mlp_bindingP_0
   |- Hnf4a_2640.2_v2_deBruijn.txt_Int_mlpout_L12_1.mlp_bindingP_0_randomBackground_100
demo6_chemicalPotential:
In this demo, we utilize bayesPI_chemicalPotential tool to estimate TF chemical potential.
Input
demo6_chemicalPotential/in/Hnf4a_2640.2_v1_deBruijn.txt_fa
demo6_chemicalPotential/in/Hnf4a_2640.2_v2_deBruijn.txt_Int_mlpout_L12_1.mlp
demo6_chemicalPotential/in/Hnf4a_2640.2_v2_deBruijn.txt_Int_Wij_L12_1.intect
demo6_chemicalPotential/in/Hnf4a_2640.2_v1_deBruijn.txt_Int
Code
echo "Estimate chemical potential for a PSM with di-nulceodtid dependence matrix and add 6bp flank seuquence on both sides of DNA sequences"
rm ../out/Hnf4a_2640.2_v1_deBruijn.txt_Int_Wij_L12_4.interct &> /dev/null
rm ../out/Hnf4a_2640.2_v1_deBruijn.txt_Int_mlpout_L12_4.mlp &> /dev/null
../../bin/$OS/bayesPI_chemicalPotential -out=../out/ \
   -seq=../in/Hnf4a_2640.2_v1_deBruijn.txt_fa \
   -psam=../in/Hnf4a_2640.2_v2_deBruijn.txt_Int_mlpout_L12_1.mlp \
   -di_nucfile=../in/Hnf4a_2640.2_v2_deBruijn.txt_Int_Wij_L12_1.intect \
   -exp=../in/Hnf4a_2640.2_v1_deBruijn.txt_Int \
   -max_evidence=4 -flank_sequence=5 &> /dev/null
Output
out
   |- Hnf4a_2640.2_v1_deBruijn.txt_Int_mlpout_L12_4.mlp
   |- Hnf4a_2640.2_v1_deBruijn.txt_Int_Wij_L12_4.interct